Superstore Dashboard
In this dataset, we have many features in regard to Customer, Executive, Orders, and Products. They are independent variables.
We will analyze the dataset divided into 9 sections:
1. Overall Performance
2. Market Share
3. Customer
4. Root Cause Analysis
5. Cohort Analysis
6. Products
7. RFM Analysis
8. Sale Analysis
9. Profit Analysis
In this dataset, we will discover some observations and give action at the same time
Observations:
Customer Behaviour
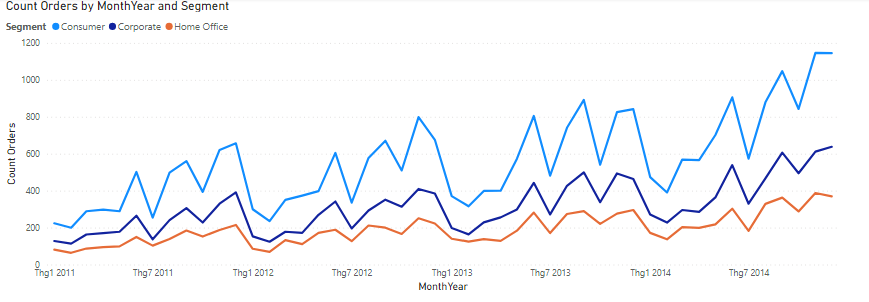
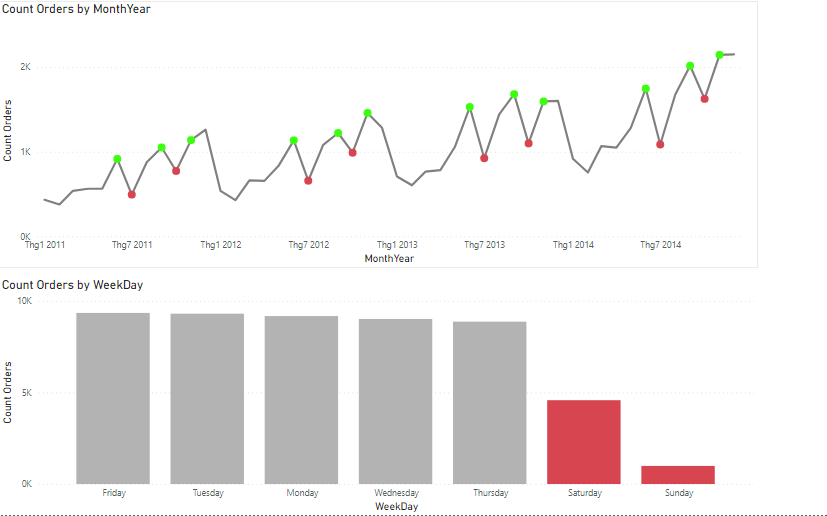
- The consumer is always the best customer of the company with nearly 1200 orders in December 2014. It's doubled as the number as Corporate and many times as Home Office
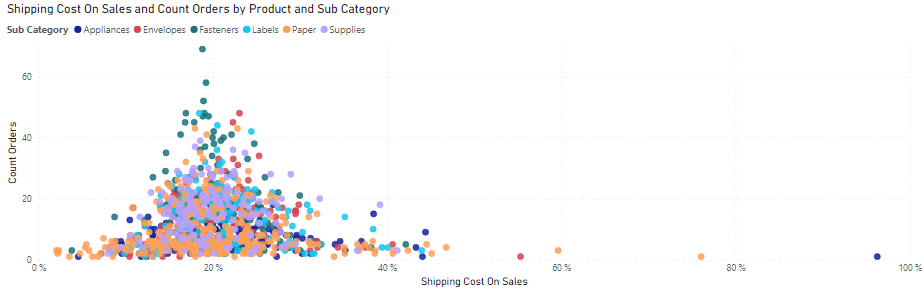
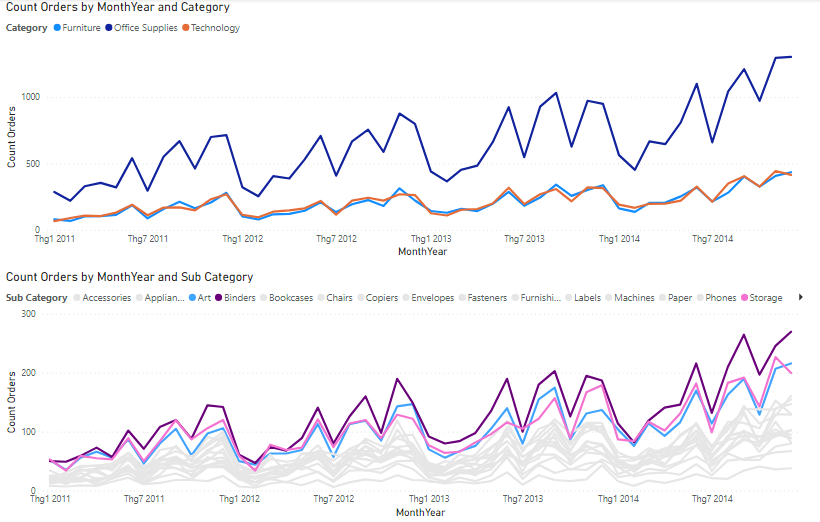
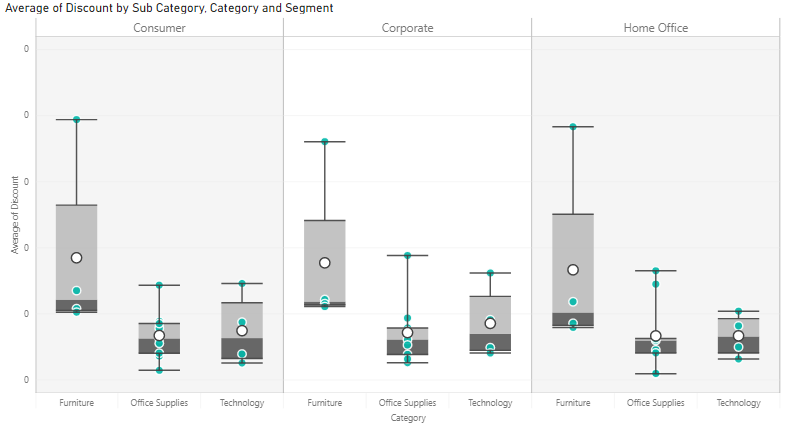
- Almost customers choose to purchase some products belonging to the office supplies category, in specific that is Binder, Storage, and Art, in spite of their price being higher than the others and the discount policy is still low
- Customers tend to purchase most from April to June, August to September, and from November to the end of the year. But follow by, July and October sell the worst
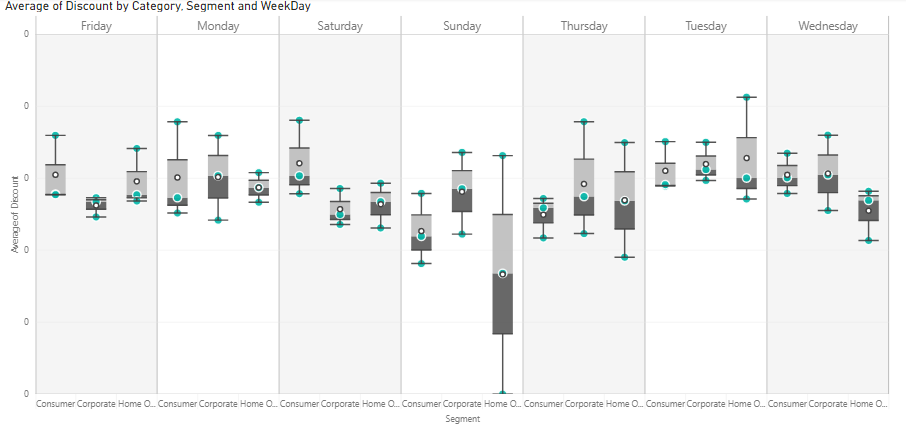
- During the week, both Saturday and Sunday sell the lowest orders, worst sales than others
Actions:
Giving more coupons and discount policies to engage customers to buy items on the weekend
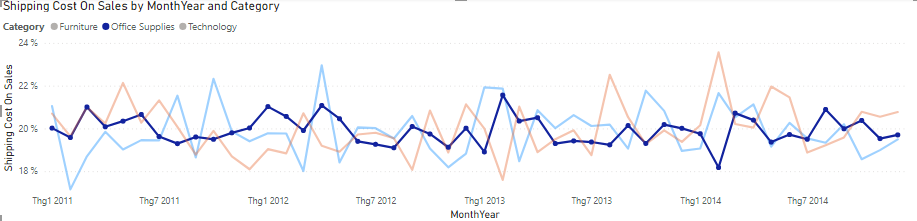
Reduce shipping costs on weekends and lowest selling month
Reduce shipping costs and give more discounts on other products except for Binder, Storage, Art